Market Outlook
September 05, 2017
Market Cues
Domestic Indices
Chg (%)
(Pts)
(Close)
Indian markets are likely to open flat tracking global indices and SGX Nifty.
BSE Sensex
(0.6)
(190)
31,702
US market were closed due to a Public holiday.
Nifty
(0.6)
(62)
9,913
UK stocks closed down reacting to the news of the North Korean nuclear test and the
Mid Cap
(0.7)
(106)
15,580
corresponding rising tensions. Mining stocks gained during the session, with
Small Cap
(0.6)
(100)
16,030
Fresnillo and Randgold Resources up 2.9% and 2% respectively. Gold prices rallied
to almost their year high as investors moved towards safe haven assets due to rising
Bankex
(0.8)
(215)
27,410
global tensions.
Global Indices
Chg (%)
(Pts)
(Close)
Indian markets corrected on news of the North Korean nuclear test. Almost all
indices closed lower for the session. The biggest correction was seen in the IT index,
Dow Jones
0.2
139
21,988
which closed down 1 percent. The auto index also reversed some of Friday’s gains
Nasdaq
0.1
57
6,435
to close down 0.8 percent. The only sectoral index to close positive was the metal
index, which closed up 0.26 percent.
FTSE
(0.4)
(27)
7,411
Nikkei
(0.9)
(183)
19,508
News Analysis
Hang Seng
(0.8)
(213)
27,740
Parle and Manpasand Beverages announce partnership
Shanghai Com
0.4
12
3,380
Ashok Leyland launches 'DOST +' to support LCV business
Detailed analysis is on Pg2
Advances / Declines
BSE
NSE
Advances
1,993
1,581
Investor’s Ready Reckoner
Declines
1,692
1,126
Key Domestic & Global Indicators
Unchanged
160
73
Stock Watch: Latest investment recommendations on 150+ stocks
Refer Pg7 onwards
Volumes (` Cr)
Top Picks
BSE
3,397
CMP
Target
Upside
Company
Sector
Rating
NSE
24,830
(`)
(`)
(%)
Blue Star
Capital Goods
Accumulate
754
760
0.8
Dewan Housing FinanceFinancials
Accumulate
521
545
4.6
#Net Inflows (` Cr)
Net
Mtd
Ytd
Mahindra Lifespace
Real Estate
Buy
448
522
16.4
FII
(5(745)
(2,2(745)
4146,54
Navkar Corporation
Others
Buy
199
265
33.4
MFs
8566
417,222
1468,16
KEI Industries
Capital Goods
Accumulate
256
290
13.3
More Top Picks on Pg5
Top Gainers
Price (`)
Chg (%)
Key Upcoming Events
Bomdyeing
135
10.0
Previous
Consensus
Date
Region
Event Description
Reading
Expectations
Tv18Brdcst
41
7.8
Sep 05, 2017 Germany PMI Services
53.40
53.40
Raymond
858
5.7
Sep 07, 2017 US
Initial Jobless claims
236.00
242.00
Srtransfin
1,074
5.3
Sep 07, 2017 Euro Zone ECB announces interest rates
-
-
Suntv
807
5.1
Sep 07, 2017 Euro Zone Euro-Zone GDP s.a. (QoQ)
0.60
0.60
Sep 08, 2017 India
Imports YoY%
15.40
More Events on Pg7
Top Losers
Price (`)
Chg (%)
Adanipower
231
(5.2)
Justdial*
381
(4.6)
Relcapital
820
(4.4)
Ioc
430
(4.2)
Adanient
131
(4.1)
#as on 04th Sep, 2017
Market Outlook
September 05, 2017
News Analysis
Parle and Manpasand Beverages announce partnership
Parle Products and Manpasand Beverages announced an exclusive tie-up for
distribution network sharing and cross-promotion of their brands. Under the
partnership, Manpasand Beverages will have access to Parle's 4.5 mln outlets for
its flagship brand 'Mango Sip'.
Manpasand Beverages has introduced a new packaging called as - 'Mango Sip
Gold'- for this partnership. Under the partnership, Parle biscuit packs and wafers
will be offered along with Mango Sip's products.
Currently, a pilot programme (involving two lakh outlets) is underway in eastern
region of the country. Under this tie-up, both companies will cross-promote their
brands and aim to achieve a significant market share in snacks and biscuits and
the beverage industry.
Ashok Leyland launches 'DOST +' to support LCV business
Ashok Leyland announced the launch of 'Dost +', a light commercial vehicle (LCV),
which will be launched in a phased manner starting with Telangana.
This new LCV targets the upper-end of the small commercial vehicle space in the
2-3.5 tonne segment. While the medium to heavy commercial vehicle market
undergoes periodic cycles of growth and slowdown, LCVs can help hedge against
such volatility as this segment has stable growth.
Ashok Leyland currently enjoys a 40 percent market share in the LCV segment due
to existing DOST and Partner models. The implementation of Goods and Services
Tax (GST) would give a boost to higher tonnage LCVs, as these vehicles are
suitable for the hub and spoke distribution channels.
Economic and Political News
Rainfall deficit narrowed to 3 % last week: Morgan Stanley
Private traders import 11,400 tonnes onion to boost domestic supply
Odisha raises fresh demand notices to 152 miners guilty of overproduction
Corporate News
ONGC seeks shareholders' approval to raise `25,000cr
IOCL to complete Paradip-Durgapur LPG pipeline by March 2018
JBM Auto Q1FY18 net profit up 5% YoY to`19.45cr
Market Outlook
September 05, 2017
Top Picks
Market Cap
CMP
Target
Upside
Company
Rationale
(` Cr)
(`)
(`)
(%)
Strong growth in domestic business due to its leadership
in acute therapeutic segment. Alkem expects to launch
Alkem Laboratories
21,538
1,801
2,161
20.0
more products in USA, which bodes for its international
business.
We expect the company would report strong profitability
Asian Granito
1,370
455
480
5.4
owing to better product mix, higher B2C sales and
amalgamation synergy.
Favorable outlook for the AC industry to augur well for
Cooling products business which is out pacing the
Blue Star
7,223
754
760
0.8
market growth. EMPPAC division's profitability to improve
once operating environment turns around.
With a focus on the low and medium income (LMI)
consumer segment, the company has increased its
Dewan Housing Finance
16,331
521
545
4.6
presence in tier-II & III cities where the growth
opportunity is immense.
Loan growth is likely to pick up after a sluggish FY17.
Karur Vysya Bank
8,787
145
160
10.0
Lower credit cost will help in strong bottom-line growth.
Increasing share of CASA will help in NIM improvement.
High order book execution in EPC segment, rising B2C
KEI Industries
1,991
256
290
13.3
sales and higher exports to boost the revenues and
profitability
Speedier execution and speedier sales, strong revenue
Mahindra Lifespace
2,301
448
522
16.4
visibility in short-to-long run, attractive valuations
Expected to benefit from the lower capex requirement
Music Broadcast
2,105
369
434
17.6
and 15 year long radio broadcast licensing.
Massive capacity expansion along with rail advantage at
Navkar Corporation
2,834
199
265
33.4
ICD as well CFS augurs well for the company
Strong brands and distribution network would boost
Siyaram Silk Mills
2,097
2,237
2,500
11.8
growth going ahead. Stock currently trades at an
inexpensive valuation.
Market leadership in Hindi news genre and no.
2
viewership ranking in English news genre, exit from the
TV Today Network
1,536
257
344
33.6
radio business, and anticipated growth in ad spends by
corporates to benefit the stock.
After GST, the company is expected to see higher
volumes along with improving product mix. The Gujarat
Maruti Suzuki
2,35,736
7,804
8,544
9.5
plant will also enable higher operating leverage which
will be margin accretive.
Source: Company, Angel Research
Market Outlook
September 05, 2017
Key Upcoming Events
Global economic events release calendar
Bloomberg Data
Date
Time
Country
Event Description
Unit
Period
Last Reported
Estimated
Sep 05, 2017
1:25 PMGermany
PMI Services
Value
Aug F
53.40
53.40
Sep 07, 2017
6:00 PMUS
Initial Jobless claims
Thousands
Sep 2
236.00
242.00
5:15 PMEuro Zone
ECB announces interest rates
%
Sep 7
-
-
2:30 PMEuro Zone
Euro-Zone GDP s.a. (QoQ)
% Change
2Q F
0.60
0.60
Sep 08, 2017
India
Imports YoY%
% Change
Aug
15.40
China
Exports YoY%
% Change
Aug
7.20
6.00
India
Exports YoY%
% Change
Aug
3.94
2:00 PMUK
Industrial Production (YoY)
% Change
Jul
0.30
0.30
Sep 09, 2017
7:00 AMChina
Consumer Price Index (YoY)
% Change
Aug
1.40
1.60
Sep 12, 2017
2:00 PMUK
CPI (YoY)
% Change
Aug
2.60
5:30 PMIndia
Industrial Production YoY
% Change
Jul
(0.10)
Sep 13, 2017
2:00 PMUK
Jobless claims change
% Change
Aug
(4.20)
US
Producer Price Index (mom)
% Change
Aug
(0.20)
Sep 14, 2017
7:30 AMChina
Industrial Production (YoY)
% Change
Aug
6.40
6.50
12:00 PMIndia
Monthly Wholesale Prices YoY%
% Change
Aug
1.88
6:00 PMUS
Consumer price index (mom)
% Change
Aug
0.10
0.30
4:30 PMUK
BOE Announces rates
% Ratio
Sep 14
0.25
Sep 15, 2017
2:30 PMEuro Zone
Euro-Zone CPI (YoY)
%
Aug F
1.50
Sep 18, 2017
6:45 PMUS
Industrial Production
%
Aug
0.19
0.20
Sep 19, 2017
6:00 PMUS
Housing Starts
Thousands
Aug
1,155.00
6:00 PMUS
Building permits
Thousands
Aug
1,230.00
Sep 20, 2017
7:30 PMUS
Existing home sales
Million
Aug
5.44
11:30 PMUS
FOMC rate decision
%
Sep 20
1.25
1.25
Sep 21, 2017
7:30 PMEuro Zone
Euro-Zone Consumer Confidence
Value
Sep A
(1.50)
Sep 22, 2017
1:00 PMGermany
PMI Manufacturing
Value
Sep P
59.30
Source: Bloomberg, Angel Research
Market Outlook
September 05, 2017
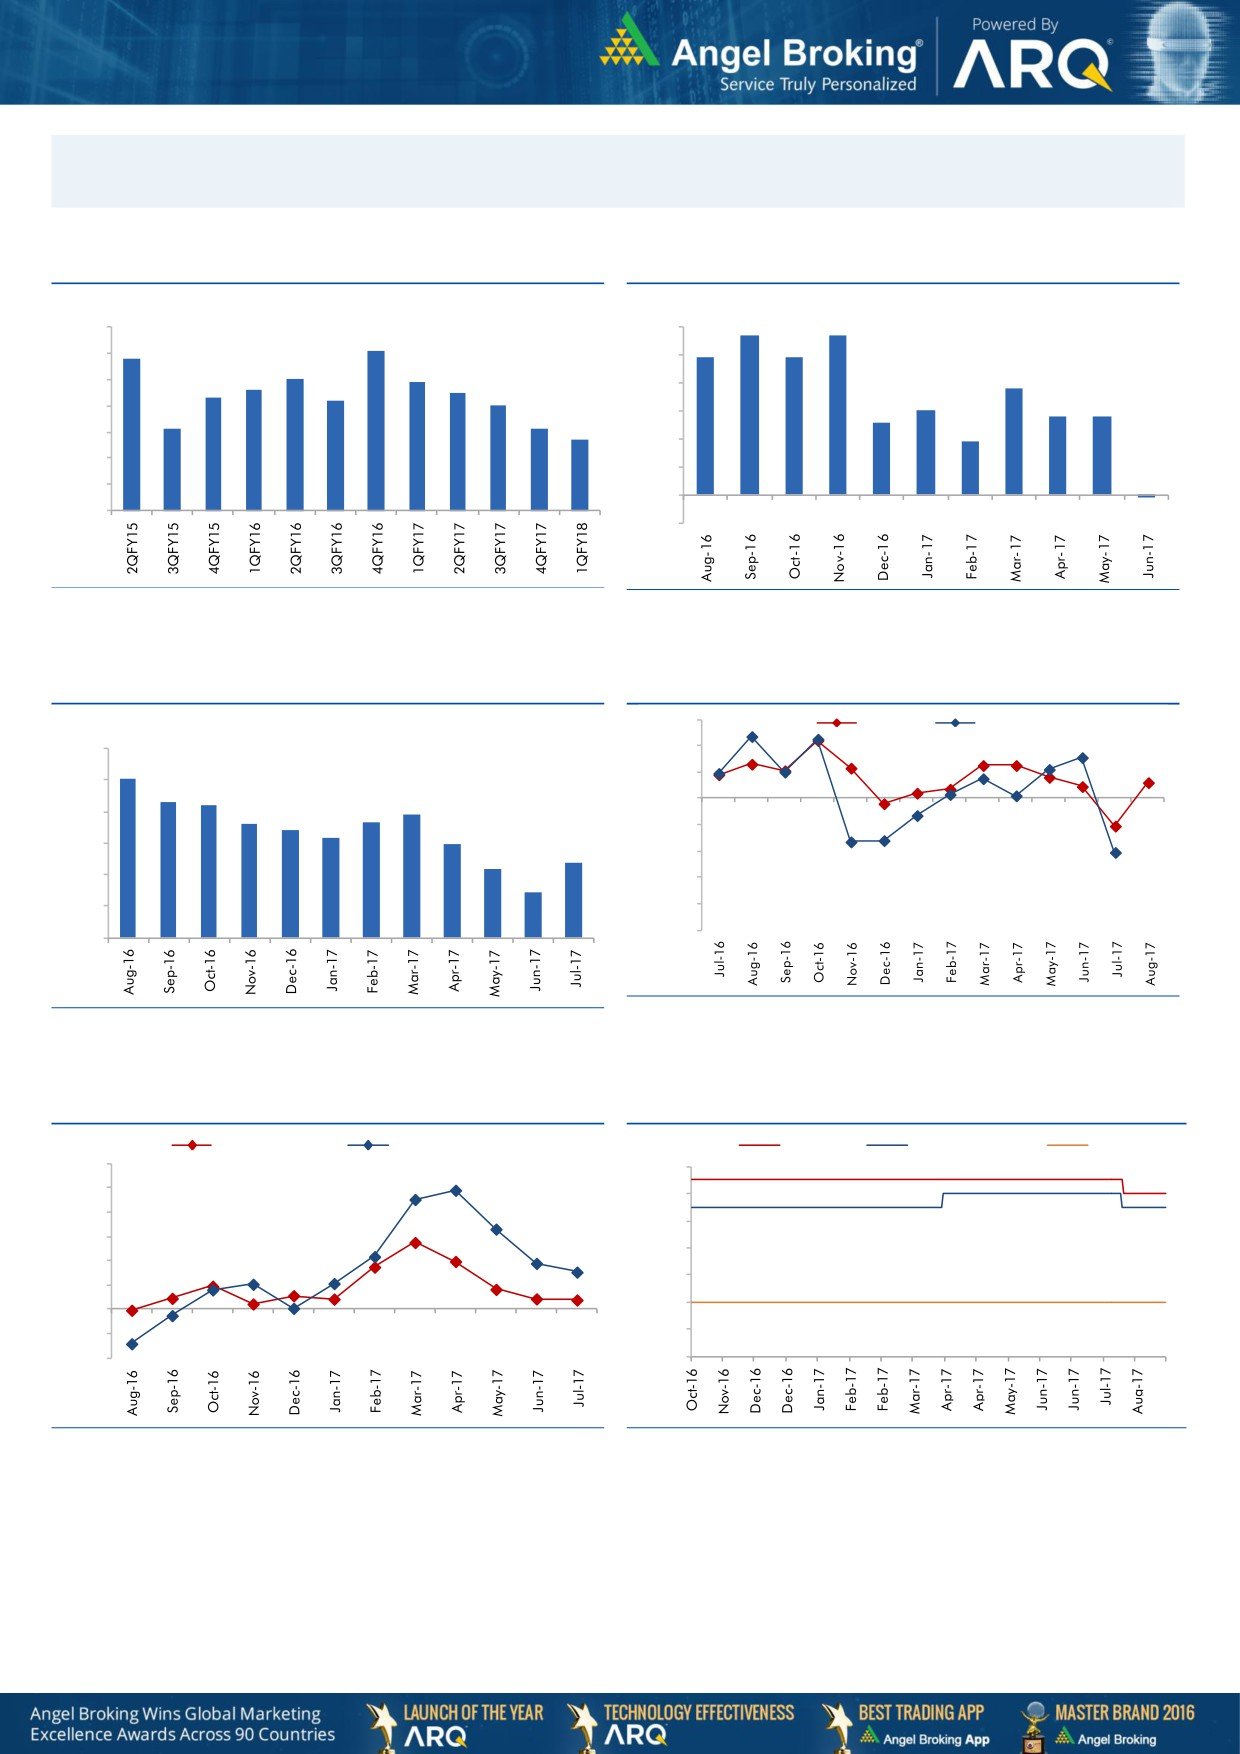
Macro watch
Exhibit 1: Quarterly GDP trends
Exhibit 2: IIP trends
(%)
(%)
5.7
5.7
10.0
6.0
9.1
8.8
4.9
4.9
9.0
5.0
8.0
7.9
7.6
7.5
3.8
8.0
7.3
7.2
4.0
7.0
3.0
2.6
2.8
2.8
7.0
6.1
6.1
3.0
5.7
1.9
6.0
2.0
5.0
1.0
4.0
-
3.0
(0.1)
(1.0)
Source: CSO, Angel Research
Source: MOSPI, Angel Research
Exhibit 3: Monthly CPI inflation trends
Exhibit 4: Manufacturing and services PMI
56.0
Mfg. PMI
Services PMI
(%)
6.0
54.0
5.1
52.0
5.0
4.3
4.2
3.9
50.0
3.6
3.7
4.0
3.4
3.2
3.0
48.0
3.0
2.4
2.2
46.0
2.0
1.5
44.0
1.0
42.0
40.0
-
Source: Market, Angel Research; Note: Level above 50 indicates expansion
Source: MOSPI, Angel Research
Exhibit 5: Exports and imports growth trends
Exhibit 6: Key policy rates
(%)
Exports yoy growth
Imports yoy growth
(%)
Repo rate
Reverse Repo rate
CRR
60.0
6.50
50.0
6.00
40.0
5.50
30.0
5.00
20.0
4.50
10.0
4.00
0.0
(10.0)
3.50
(20.0)
3.00
Source: Bloomberg, Angel Research
Source: RBI, Angel Research
Market Outlook
September 05, 2017
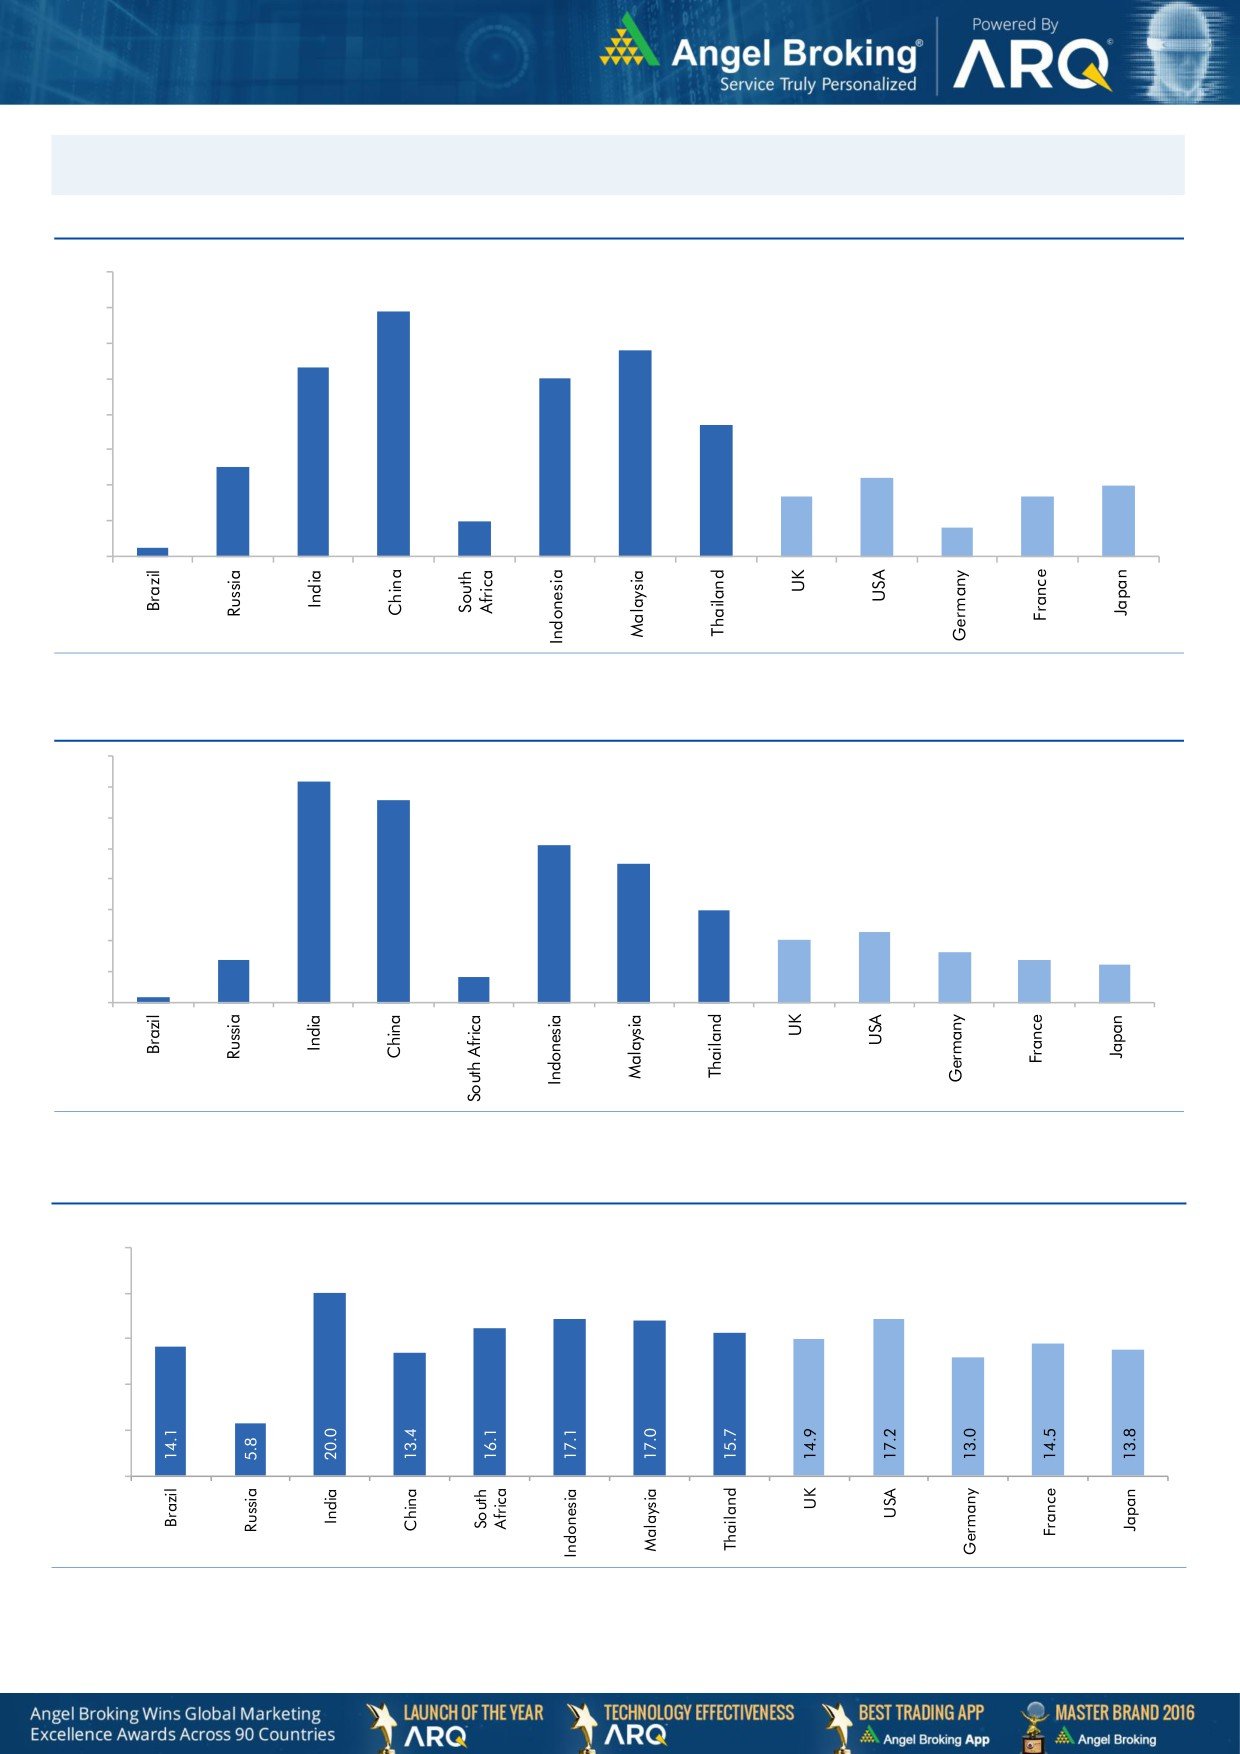
Global watch
Exhibit 1: Latest quarterly GDP Growth (%, yoy) across select developing and developed countries
(%)
8.0
6.9
7.0
5.8
6.0
5.3
5.0
5.0
1.0
3.7
4.0
2.5
3.0
2.2
1.7
1.7
2.0
2.0
0.8
1.0
0.3
-
Source: Bloomberg, Angel Research
Exhibit 2: 2017 GDP Growth projection by IMF (%, yoy) across select developing and developed countries
(%)
7.2
6.6
7.0
6.0
5.1
5.0
4.5
4.0
3.0
3.0
2.3
2.0
1.4
1.6
2.0
1.4
1.2
0.2
0.8
1.0
-
Source: IMF, Angel Research
Exhibit 3: One year forward P-E ratio across select developing and developed countries
(x)
25.0
20.0
15.0
10.0
5.0
-
Source: IMF, Angel Research
Market Outlook
September 05, 2017
Exhibit 4: Relative performance of indices across globe
Returns (%)
Country
Name of index
Closing price
1M
3M
1YR
Brazil
Bovespa
71,923
7.1
15.1
22.8
Russia
Micex
2,011
2.0
6.7
(1.8)
India
Nifty
9,974
(2.0)
3.1
15.2
China
Shanghai Composite
3,367
3.3
8.9
9.4
South Africa
Top 40
49,996
2.1
7.1
7.9
Mexico
Mexbol
51,081
(0.2)
3.0
6.9
Indonesia
LQ45
977
0.0
0.8
2.6
Malaysia
KLCI
1,773
0.7
0.5
5.4
Thailand
SET 50
1,034
2.9
4.7
5.2
USA
Dow Jones
21,988
(0.1)
3.7
18.9
UK
FTSE
7,439
(0.0)
(2.1)
9.2
Japan
Nikkei
19,691
(2.3)
(0.9)
18.2
Germany
DAX
12,143
(0.4)
(4.6)
13.4
France
CAC
5,123
(0.3)
(3.0)
15.2
Source: Bloomberg, Angel Research
Stock Watch
September 05, 2017
Company Name
Reco
CMP
Target
Mkt Cap
Sales ( Čcr )
OPM(%)
EPS (Č)
PER(x)
P/BV(x)
RoE(%)
EV/Sales(x)
(Č)
Price ( Č)
( Č cr )
FY18E FY19E
FY18E
FY19E
FY18E
FY19E
FY18E
FY19E
FY18E
FY19E
FY18E
FY19E
FY18E
FY19E
Agri / Agri Chemical
Rallis
Reduce
223
209
4,331
1,873
2,099
15.0
15.0
9.5
10.5
23.4
21.2
3.6
3.2
15.8
16.0
2.2
2.0
United Phosphorus
Neutral
817
-
41,511
18,922
21,949
18.0
18.5
36.2
45.6
22.6
17.9
4.7
3.9
22.7
23.8
2.4
2.0
Auto & Auto Ancillary
Ashok Leyland
Accumulate
113
127
33,114
23,339
27,240
10.1
10.8
4.7
6.2
24.3
18.2
4.9
4.3
20.0
23.6
1.4
1.2
Bajaj Auto
Accumulate
2,913
3,151
84,304
23,936
27,955
19.5
20.1
142.7
167.3
20.4
17.4
4.4
4.0
21.8
22.8
3.1
2.6
Bharat Forge
Neutral
1,124
-
26,158
7,637
8,755
21.7
23.2
36.1
47.3
31.1
23.8
5.6
4.8
18.5
20.8
3.3
2.8
Eicher Motors
Neutral
31,754
-
86,440
19,043
22,837
19.5
19.9
835.4
1,019.0
38.0
31.2
14.2
10.9
40.9
37.8
4.4
3.6
Gabriel India
Neutral
175
-
2,512
1,782
2,033
9.7
10.2
7.1
8.9
24.6
19.8
5.0
4.2
21.0
22.2
1.4
1.2
Hero Motocorp
Neutral
3,974
-
79,352
32,239
36,878
16.0
15.6
184.4
206.5
21.6
19.3
6.8
5.9
31.3
30.7
2.2
1.9
Jamna Auto Industries Neutral
258
-
2,057
1,441
1,662
14.4
14.8
13.9
17.6
18.6
14.7
5.1
4.1
30.0
31.0
1.4
1.2
Mahindra and Mahindra Neutral
1,328
-
82,490
46,971
53,816
13.6
14.0
67.7
79.8
19.6
16.6
2.8
2.5
15.0
15.9
1.6
1.4
Maruti
Accumulate
7,804
8,544
235,736
81,825
101,245
15.0
15.0
283.5
356.0
27.5
21.9
6.0
4.9
21.9
22.4
2.6
2.0
Minda Industries
Neutral
878
-
7,585
4,328
5,084
11.0
11.9
27.3
36.4
32.2
24.1
6.8
5.3
23.1
25.6
1.8
1.6
Motherson Sumi
Neutral
313
-
65,986
55,937
64,445
10.8
11.4
16.9
21.1
18.6
14.9
4.2
4.2
25.2
25.4
1.2
1.0
Tata Motors
Neutral
384
-
110,990
303,167
343,649
11.8
13.8
33.1
54.7
11.6
7.0
1.9
1.5
16.9
23.0
0.4
0.3
TVS Motor
Neutral
614
-
29,161
13,992
16,216
9.0
9.4
17.1
20.3
36.0
30.2
9.6
7.4
29.7
27.7
2.0
1.7
Amara Raja Batteries
Accumulate
786
858
13,431
6,140
7,122
14.3
15.6
29.3
39.0
26.8
20.2
4.6
3.8
17.1
19.0
2.2
1.9
Exide Industries
Neutral
203
-
17,251
8,689
9,854
15.1
15.2
9.7
11.0
21.0
18.5
3.7
3.3
15.7
16.1
1.7
1.5
Apollo Tyres
Neutral
251
-
12,759
15,739
17,326
13.3
14.6
20.4
26.7
12.3
9.4
1.5
1.3
20.4
26.7
1.0
0.9
Ceat
Neutral
1,706
-
6,900
6,661
7,717
11.1
14.2
116.2
178.2
14.7
9.6
2.6
2.1
15.2
21.3
1.1
1.0
JK Tyres
Neutral
147
-
3,340
8,318
9,239
16.2
16.4
21.0
27.5
7.0
5.4
1.4
1.1
19.1
20.4
0.9
0.7
Swaraj Engines
Neutral
2,098
-
2,606
788
889
16.4
16.5
71.6
81.0
29.3
25.9
8.5
7.8
29.6
31.0
3.0
2.6
Subros
Neutral
242
-
1,450
1,855
2,135
11.6
11.8
10.3
14.7
23.6
16.5
3.6
3.1
15.8
19.1
1.0
0.9
Capital Goods
BEML
Neutral
1,855
-
7,723
4,286
5,194
7.1
8.2
42.9
58.1
43.2
31.9
3.6
3.2
7.6
8.7
1.9
1.5
Bharat Electronics
Neutral
192
-
42,819
10,258
12,470
19.6
19.5
7.3
8.6
26.3
22.3
0.5
0.5
20.4
21.9
3.7
3.0
Voltas
Neutral
519
-
17,185
6,778
8,004
9.6
11.0
17.1
22.4
30.4
23.2
7.2
6.4
17.7
19.8
2.2
1.9
BHEL
Neutral
131
-
32,051
33,200
39,167
6.8
9.5
6.2
11.2
21.1
11.7
1.0
0.9
4.6
8.0
0.5
0.4
Blue Star
Neutral
754
-
7,223
5,101
5,997
6.0
7.0
17.9
26.6
42.1
28.4
9.0
8.2
21.9
29.0
1.4
1.2
CG Power and Industrial
Neutral
81
-
5,080
6,555
7,292
7.5
7.5
-
0.8
8,105.0
101.3
1.3
1.3
0.1
1.2
0.9
0.8
Solutions
Greaves Cotton
Neutral
157
-
3,832
1,778
1,993
14.7
15.1
8.1
9.1
19.4
17.2
4.4
4.1
21.8
23.6
1.9
1.7
Stock Watch
September 05, 2017
Company Name
Reco
CMP
Target
Mkt Cap
Sales ( Čcr )
OPM(%)
EPS (Č)
PER(x)
P/BV(x)
RoE(%)
EV/Sales(x)
(Č)
Price ( Č)
( Č cr )
FY18E FY19E
FY18E
FY19E
FY18E
FY19E
FY18E
FY19E
FY18E
FY19E
FY18E
FY19E
FY18E
FY19E
Capital Goods
KEC International
Neutral
306
-
7,864
9,779
11,113
9.4
9.8
14.2
18.2
21.5
16.8
4.1
3.4
21.1
22.1
1.1
0.9
KEI Industries
Accumulate
256
290
1,991
3,001
3,391
10.0
10.0
13.0
16.1
19.7
15.9
3.6
3.0
18.2
18.7
0.8
0.7
Thermax
Neutral
881
-
10,502
4,125
4,747
10.3
10.8
26.7
31.5
33.0
28.0
3.7
3.4
11.2
12.0
2.3
2.0
VATech Wabag
Accumulate
611
681
3,334
3,867
4,126
9.6
10.0
34.9
39.8
17.5
15.4
2.9
2.5
17.7
17.5
0.9
0.8
Cement
ACC
Neutral
1,774
-
33,313
12,255
13,350
13.5
14.3
58.0
66.2
30.6
26.8
3.6
3.4
11.5
12.2
2.7
2.5
Ambuja Cements
Neutral
276
-
54,893
10,250
11,450
17.5
19.0
7.2
8.3
38.4
33.3
2.8
2.6
7.0
7.8
5.1
4.5
India Cements
Neutral
177
-
5,453
6,135
6,750
14.8
15.2
8.5
11.5
20.8
15.4
1.0
1.0
4.8
6.2
1.2
1.1
JK Cement
Neutral
1,003
-
7,009
4,150
4,775
19.2
20.0
49.0
63.5
20.5
15.8
3.2
2.8
17.0
18.5
2.1
1.8
J K Lakshmi Cement
Neutral
431
-
5,069
3,422
3,757
15.5
17.0
13.5
23.2
31.9
18.6
3.3
2.9
10.8
15.5
1.9
1.6
Orient Cement
Neutral
157
-
3,212
2,215
3,233
16.8
17.0
5.9
6.9
26.6
22.7
2.0
1.9
10.8
10.1
2.4
1.6
UltraTech Cement
Neutral
3,988
-
109,476
28,250
35,150
20.2
23.5
77.5
122.2
51.5
32.6
4.3
3.9
9.6
14.8
4.3
3.5
Construction
KNR Constructions
Neutral
208
-
2,923
1,846
2,203
14.5
14.5
12.1
13.7
17.2
15.2
0.9
0.8
17.5
16.7
1.6
1.4
Larsen & Toubro
Neutral
1,130
-
158,255
95,787
109,476
10.2
11.6
44.5
50.8
25.4
22.3
3.2
2.9
12.9
13.1
2.2
1.9
Gujarat Pipavav Port
Neutral
130
-
6,287
739
842
61.6
62.7
5.1
6.2
25.5
21.2
3.2
3.1
12.7
14.9
8.0
6.9
PNC Infratech
Neutral
137
-
3,504
2,040
2,935
13.0
13.0
6.4
9.0
21.3
15.2
0.6
0.5
9.7
12.2
1.7
1.2
Simplex Infra
Neutral
476
-
2,356
6,012
6,619
11.6
11.7
21.1
31.0
22.6
15.4
1.6
1.4
6.5
8.6
0.9
0.8
Sadbhav Engineering
Neutral
286
-
4,904
3,823
4,426
10.7
10.8
10.3
11.8
27.8
24.2
3.3
2.9
10.1
10.5
1.6
1.4
NBCC
Neutral
207
-
18,585
9,099
12,706
6.4
6.4
7.3
9.6
28.4
21.6
1.3
1.0
27.5
30.5
1.9
1.4
MEP Infra
Neutral
116
-
1,882
2,403
2,910
18.3
16.8
2.4
6.1
49.2
19.1
18.7
12.6
35.2
55.8
1.9
1.6
SIPL
Neutral
100
-
3,522
2,060
2,390
46.8
47.7
(5.8)
(3.1)
3.8
4.3
(14.2)
(2.3)
6.5
6.1
Engineers India
Neutral
155
-
10,435
1,795
2,611
21.1
22.4
5.9
8.1
26.3
19.1
1.9
1.8
12.9
16.1
4.2
2.7
Financials
Axis Bank
Buy
502
580
120,432
32,558
35,843
3.5
3.2
27.8
41.0
18.1
12.2
2.0
1.7
11.4
14.9
-
-
Bank of Baroda
Neutral
137
-
31,509
22,533
26,079
2.4
2.4
12.0
20.9
11.4
6.5
0.7
0.7
6.6
11.0
-
-
Canara Bank
Neutral
336
-
20,039
17,925
20,235
2.0
2.1
18.5
36.5
18.1
9.2
0.7
0.7
3.4
6.2
-
-
Can Fin Homes
Neutral
2,820
-
7,508
586
741
3.5
3.5
107.8
141.0
26.2
20.0
5.7
4.6
24.1
25.6
-
-
Cholamandalam Inv. &
Accumulate
1,135
1,230
17,742
2,826
3,307
6.3
6.3
53.7
64.6
21.2
17.6
3.6
3.1
18.3
18.9
-
-
Fin. Co.
Dewan Housing Finance Neutral
521
-
16,331
2,676
3,383
2.4
2.7
37.4
49.7
13.9
10.5
1.8
1.6
13.8
16.2
-
-
Equitas Holdings
Buy
170
235
5,744
1,125
1,380
9.6
9.8
1.5
6.0
113.0
28.3
2.6
2.4
2.4
8.2
-
-
Federal Bank
Accumulate
112
125
21,711
4,896
5,930
2.8
3.1
5.4
7.6
20.8
14.8
1.8
1.6
8.5
11.0
-
-
Stock Watch
September 05, 2017
Company Name
Reco
CMP
Target
Mkt Cap
Sales ( Čcr )
OPM(%)
EPS (Č)
PER(x)
P/BV(x)
RoE(%)
EV/Sales(x)
(Č)
Price ( Č)
( Č cr )
FY18E FY19E
FY18E
FY19E
FY18E
FY19E
FY18E
FY19E
FY18E
FY19E
FY18E
FY19E
FY18E
FY19E
Financials
HDFC Bank
Neutral
1,752
-
451,229
55,236
63,253
4.5
4.4
68.9
82.4
25.5
21.3
4.4
3.7
18.7
18.5
-
-
ICICI Bank
Accumulate
297
315
190,609
42,361
51,378
3.6
3.9
18.4
25.7
16.2
11.6
1.8
1.7
11.3
15.0
-
-
Karur Vysya Bank
Accumulate
145
160
8,787
3,289
3,630
3.7
3.9
10.8
14.1
13.4
10.3
1.6
1.4
12.5
14.7
-
-
LIC Housing Finance
Neutral
677
-
34,158
4,895
6,332
3.4
3.7
50.7
66.8
13.3
10.1
2.7
2.2
21.7
23.8
-
-
Punjab Natl.Bank
Neutral
143
-
30,366
23,708
25,758
2.1
2.1
5.9
16.4
24.3
8.7
0.7
0.7
3.0
8.3
-
-
RBL Bank
Neutral
534
-
20,257
2,309
2,888
2.6
2.5
16.4
19.1
32.6
28.0
4.1
3.6
13.3
13.8
-
-
Repco Home Finance
Buy
649
825
4,061
496
597
4.4
4.2
38.5
48.7
16.9
13.3
3.0
2.5
19.6
20.6
-
-
South Ind.Bank
Neutral
29
-
5,188
3,195
3,567
3.0
3.1
3.0
3.8
9.5
7.5
1.0
0.8
10.5
11.9
-
-
St Bk of India
Neutral
278
-
239,798
105,827
121,056
2.4
2.5
16.1
25.6
17.3
10.9
1.4
1.2
6.6
9.9
-
-
Union Bank
Neutral
136
-
9,356
14,650
16,225
2.3
2.3
23.1
32.5
5.9
4.2
0.5
0.4
7.1
9.2
-
-
Yes Bank
Neutral
1,761
-
80,603
11,088
13,138
3.0
2.9
84.0
99.3
21.0
17.7
3.2
2.8
16.3
16.8
-
-
FMCG
Akzo Nobel India
Neutral
1,832
-
8,786
3,164
3,607
13.8
13.7
58.6
67.9
31.3
27.0
7.7
6.8
24.5
25.1
2.6
2.3
Asian Paints
Neutral
1,197
-
114,768
17,603
20,615
18.6
18.6
2,128.9
2,543.3
0.6
0.5
11.9
10.0
28.0
28.9
6.3
5.3
Britannia
Neutral
4,216
-
50,617
9,690
11,278
14.8
15.4
84.0
101.0
50.2
41.7
18.3
14.5
40.6
39.0
5.2
4.5
Colgate
Neutral
1,110
-
30,201
4,420
5,074
24.9
25.3
28.6
32.8
38.8
33.9
15.3
12.4
43.8
40.5
6.6
5.7
Dabur India
Neutral
310
-
54,607
8,346
9,344
19.6
19.9
7.8
9.0
39.7
34.4
8.0
7.2
25.2
24.8
6.1
5.4
GlaxoSmith Con*
Neutral
5,320
-
22,375
5,072
5,760
18.2
18.4
176.3
199.2
30.2
26.7
6.4
5.8
21.2
21.7
3.7
3.2
Godrej Consumer
Neutral
920
-
62,689
10,171
11,682
20.8
21.5
21.7
27.1
42.4
34.0
9.5
8.2
22.3
23.4
6.3
5.4
HUL
Neutral
1,197
-
259,076
37,077
41,508
20.3
21.8
5,189.9
6,318.5
0.2
0.2
36.5
31.2
74.8
82.0
6.8
6.1
ITC
Neutral
283
-
344,094
44,588
49,853
37.0
37.3
9.6
11.0
29.4
25.7
7.2
6.9
25.1
27.3
7.2
6.4
Marico
Neutral
315
-
40,650
6,788
7,766
18.5
19.2
7.1
8.5
44.4
37.1
15.5
13.3
36.9
38.0
5.8
5.1
Nestle*
Neutral
6,859
-
66,129
10,083
11,182
20.0
20.9
119.7
141.3
57.3
48.5
201.9
184.6
36.7
39.8
6.2
5.6
Tata Global
Neutral
193
-
12,190
7,121
7,641
11.9
12.3
6.9
8.0
28.0
24.1
1.9
1.8
6.8
7.2
1.5
1.4
Procter & Gamble
Neutral
8,413
-
27,309
3,034
3,579
27.1
27.7
167.7
198.8
50.2
42.3
13.5
11.6
28.8
29.5
8.4
7.1
Hygiene
IT
HCL Tech^
Buy
858
1,014
122,464
52,342
57,053
20.9
20.9
62.8
67.6
13.7
12.7
3.1
2.6
22.4
20.6
2.0
1.7
Infosys
Buy
901
1,179
207,026
73,963
80,619
26.0
26.0
64.4
69.3
14.0
13.0
2.8
2.6
19.7
19.6
2.2
2.0
TCS
Accumulate
2,458
2,651
484,292
127,403
138,870
27.6
27.6
144.5
156.0
17.0
15.8
5.1
4.7
29.7
29.8
3.5
3.1
Tech Mahindra
Buy
416
533
40,570
31,015
33,496
15.0
15.0
35.6
38.1
11.7
10.9
2.0
1.9
17.0
16.3
1.1
0.9
Wipro
Neutral
297
-
144,704
58,536
61,858
20.3
20.3
18.2
19.1
16.3
15.6
2.5
2.2
14.6
13.4
2.4
2.3
Stock Watch
September 05, 2017
Company Name
Reco
CMP
Target
Mkt Cap
Sales ( Čcr )
OPM(%)
EPS (Č)
PER(x)
P/BV(x)
RoE(%)
EV/Sales(x)
(Č)
Price ( Č)
( Č cr )
FY18E FY19E
FY18E
FY19E
FY18E
FY19E
FY18E
FY19E
FY18E
FY19E
FY18E
FY19E
FY18E
FY19E
Media
D B Corp
Neutral
376
-
6,910
2,404
2,625
30.5
31.5
23.7
26.9
15.9
14.0
3.7
3.2
23.5
22.8
2.7
2.5
HT Media
Neutral
97
-
2,248
2,589
2,830
15.1
15.4
8.3
10.9
11.6
8.9
0.9
0.9
8.4
10.4
0.4
0.3
Jagran Prakashan
Buy
179
225
5,860
2,541
2,835
28.5
28.7
12.7
14.1
14.1
12.7
2.9
2.5
21.3
21.4
2.2
1.9
Sun TV Network
Neutral
807
-
31,797
3,238
3,789
51.9
55.1
30.9
38.0
26.1
21.2
7.5
6.5
30.0
31.0
9.3
7.9
Hindustan Media
Neutral
268
-
1,968
1,002
1,074
23.3
23.5
29.2
33.8
9.2
7.9
1.4
1.2
15.6
15.4
1.0
0.7
Ventures
TV Today Network
Buy
257
344
1,536
667
727
27.7
27.7
18.6
20.1
13.8
12.8
2.2
2.2
15.6
17.3
1.8
1.7
Music Broadcast Limited Buy
369
434
2,105
271
317
91.0
109.0
6.0
10.0
61.5
36.9
3.8
3.5
6.5
9.3
7.4
6.1
Metals & Mining
Coal India
Neutral
246
-
152,951
82,301
91,235
17.0
18.0
17.1
20.5
14.4
12.0
2.7
2.5
45.0
55.0
1.5
1.4
Hind. Zinc
Neutral
299
-
126,295
22,108
24,555
57.0
58.0
22.1
26.3
13.5
11.4
4.4
3.6
32.0
35.0
4.7
3.9
Hindalco
Neutral
243
-
54,472
102,350
105,355
13.5
14.5
21.5
24.5
11.3
9.9
1.6
1.3
15.0
15.2
1.1
1.1
JSW Steel
Neutral
255
-
61,603
64,500
68,245
21.1
21.5
20.1
21.2
12.7
12.0
2.3
2.0
-
-
1.7
1.6
NMDC
Neutral
135
-
42,554
10,209
11,450
47.0
48.0
11.1
12.1
12.1
11.1
1.7
1.6
-
-
3.7
3.3
SAIL
Neutral
62
-
25,669
54,100
63,555
3.0
10.0
(10.0)
1.5
41.4
0.8
0.8
-
-
1.5
1.3
Vedanta
Neutral
316
-
117,389
81,206
87,345
28.0
29.0
26.5
33.5
11.9
9.4
2.7
2.3
-
-
2.2
1.9
Tata Steel
Neutral
646
-
62,750
121,445
126,500
16.2
17.2
65.4
81.3
9.9
8.0
1.6
1.3
-
-
1.0
0.9
Oil & Gas
GAIL
Neutral
380
-
64,202
53,115
52,344
14.2
15.3
30.0
31.1
12.7
12.2
1.6
1.5
-
-
0.9
0.9
ONGC
Neutral
162
-
207,385
83,111
84,934
44.2
44.9
16.4
16.9
9.9
9.6
1.2
1.1
-
-
2.4
2.3
Indian Oil Corp
Neutral
429
-
208,343
396,116
432,560
8.5
8.8
40.1
42.2
10.7
10.2
1.9
1.7
-
-
0.7
0.6
Reliance Industries
Neutral
1,611
-
523,995
257,711
267,438
17.0
18.2
89.1
89.5
18.1
18.0
1.7
1.6
-
-
1.7
1.6
Pharmaceuticals
Alembic Pharma
Buy
513
600
9,670
3,903
4,584
18.2
19.2
21.8
27.2
23.5
18.9
4.3
3.6
19.8
20.6
2.5
2.1
Alkem Laboratories Ltd
Buy
1,801
2,161
21,538
6,901
7,850
18.4
19.1
85.0
100.5
21.2
17.9
4.3
3.6
20.2
20.1
3.1
2.7
Aurobindo Pharma
Accumulate
749
823
43,909
17,086
19,478
22.1
22.0
44.7
51.4
16.8
14.6
3.7
3.0
24.7
22.7
2.7
2.3
Aventis*
Neutral
4,029
-
9,279
2,508
2,862
16.8
16.8
139.9
153.8
28.8
26.2
4.2
3.4
23.5
25.8
3.3
2.7
Cadila Healthcare
Sell
506
426
51,847
11,584
13,228
20.3
20.4
18.7
21.3
27.1
23.8
6.0
5.0
24.6
22.9
4.3
3.7
Cipla
Sell
562
458
45,219
16,619
19,437
15.4
16.2
19.7
24.3
28.5
23.1
3.2
2.9
12.0
13.2
2.9
2.4
Dr Reddy's
Neutral
2,189
-
36,286
15,844
17,973
17.6
18.2
91.7
111.0
23.9
19.7
2.7
2.5
11.9
13.0
2.5
2.2
GSK Pharma*
Neutral
2,423
-
20,525
3,260
3,651
15.0
18.0
46.1
58.6
52.6
41.4
10.8
11.1
20.0
26.5
6.2
5.6
Indoco Remedies
Sell
194
153
1,786
1,154
1,310
14.9
14.9
11.3
12.7
17.2
15.3
2.4
2.2
15.0
15.0
1.7
1.4
Ipca labs
Buy
417
540
5,257
3,593
4,022
14.5
15.5
19.4
25.2
21.5
16.5
2.0
1.8
9.5
11.2
1.5
1.4
Stock Watch
September 05, 2017
Company Name
Reco
CMP
Target
Mkt Cap
Sales ( Čcr )
OPM(%)
EPS (Č)
PER(x)
P/BV(x)
RoE(%)
EV/Sales(x)
(Č)
Price ( Č)
( Č cr )
FY18E FY19E
FY18E
FY19E
FY18E
FY19E
FY18E
FY19E
FY18E
FY19E
FY18E
FY19E
FY18E
FY19E
Pharmaceuticals
Lupin
Buy
996
1,467
44,990
18,657
21,289
21.3
23.3
52.8
66.7
18.9
14.9
2.9
2.4
16.3
17.5
2.4
2.0
Natco Pharma
Accumulate
704
796
12,263
1,836
1,946
31.8
28.9
22.1
20.6
31.8
34.1
6.4
5.7
20.1
16.7
6.5
6.1
Sun Pharma
Accumulate
501
558
120,094
32,899
36,451
26.9
25.4
31.6
32.3
15.8
15.5
2.8
2.4
18.7
18.8
3.3
2.8
Syngene International
Buy
447
557
8,935
1,402
1,823
32.8
36.0
15.9
20.7
28.1
21.6
5.3
4.3
18.7
20.0
6.3
4.9
Power
Tata Power
Neutral
78
-
21,219
32,547
33,806
20.5
20.5
4.7
5.4
16.7
14.7
1.6
1.4
10.5
10.5
1.6
1.6
NTPC
Neutral
168
-
138,441
86,070
101,246
28.3
30.7
12.9
16.2
13.0
10.4
1.3
1.2
10.6
12.4
3.0
2.7
Power Grid
Neutral
217
-
113,473
29,183
32,946
89.7
90.0
18.0
20.8
12.1
10.4
2.0
1.8
17.7
18.2
7.8
7.3
Real Estate
Prestige Estate
Neutral
265
-
9,934
4,607
5,146
21.0
22.2
7.9
9.8
33.5
27.0
2.1
1.9
10.3
12.0
3.3
3.0
MLIFE
Buy
448
522
2,301
487
590
12.3
17.8
21.0
31.2
21.4
14.4
1.1
1.1
5.2
7.4
3.4
2.8
Telecom
Bharti Airtel
Neutral
416
-
166,232
97,903
105,233
36.0
36.3
9.3
11.1
44.7
37.6
2.2
2.0
5.0
5.6
2.7
2.4
Idea Cellular
Neutral
87
-
31,396
35,012
37,689
27.1
27.7
(4.4)
(2.7)
1.4
1.4
(6.8)
(4.6)
2.2
2.0
zOthers
Abbott India
Neutral
4,206
-
8,937
3,244
3,723
14.9
16.1
167.5
209.4
25.1
20.1
5.5
4.6
23.7
24.8
2.4
2.0
Asian Granito
Accumulate
455
480
1,370
1,169
1,286
12.5
12.5
16.0
19.7
28.5
23.1
3.0
2.7
10.7
11.6
1.4
1.2
Bajaj Electricals
Accumulate
345
395
3,496
4,646
5,301
6.7
7.6
16.1
22.3
21.4
15.5
3.5
3.0
16.4
19.2
0.7
0.7
Banco Products (India)
Neutral
216
-
1,548
1,530
1,695
13.2
12.7
19.0
20.0
11.4
10.8
1.8
1.6
0.2
0.2
0.9
102.3
Coffee Day Enterprises
Neutral
238
-
4,909
3,494
3,913
17.4
18.0
4.8
5.7
-
41.8
2.1
2.0
-
0.1
1.9
1.6
Ltd
Elecon Engineering
Neutral
50
-
562
171
201
15.0
16.2
36.0
43.0
1.4
1.2
0.1
0.1
0.1
0.1
2.7
2.3
Garware Wall Ropes
Neutral
926
-
2,026
928
1,003
15.2
15.2
39.4
43.2
23.5
21.5
3.9
3.3
16.5
15.4
2.1
1.8
Goodyear India*
Neutral
823
-
1,899
1,717
1,866
11.8
12.3
47.9
49.8
17.2
16.5
2.7
2.3
15.6
15.7
0.8
114.7
Hitachi
Neutral
1,998
-
5,432
2,355
2,715
10.3
10.8
49.0
60.9
40.8
32.8
9.5
7.5
0.2
0.2
2.3
2.0
HSIL
Neutral
379
-
2,741
2,240
2,670
14.6
15.0
17.0
22.0
22.3
17.2
1.8
1.7
0.1
0.1
1.4
1.2
Interglobe Aviation
Neutral
1,265
-
45,766
22,570
27,955
14.2
15.0
63.6
81.8
19.9
15.5
10.5
8.8
0.5
0.6
1.7
1.3
Jyothy Laboratories
Neutral
390
-
7,084
1,781
2,044
14.1
15.0
9.4
10.5
41.7
37.1
8.9
8.3
0.2
0.2
4.2
3.6
Linc Pen & Plastics
Neutral
241
-
356
420
462
9.3
9.3
15.3
17.1
15.8
14.1
2.7
2.8
16.9
19.5
0.9
0.8
M M Forgings
Neutral
605
-
730
542
642
20.1
21.0
41.6
56.8
14.5
10.7
2.0
1.7
0.1
0.2
1.8
1.6
Mirza International
Neutral
160
-
1,922
1,148
1,285
18.0
18.0
8.0
9.4
19.9
17.1
3.3
2.8
16.3
16.1
1.8
1.6
Navkar Corporation
Buy
199
265
2,834
561
617
41.5
41.5
11.5
12.7
17.3
15.6
1.8
1.6
10.5
10.4
5.7
5.0
Nilkamal
Neutral
1,547
-
2,308
2,317
2,525
11.4
11.1
96.0
105.0
16.1
14.7
2.7
2.4
0.2
0.2
1.0
0.9
Parag Milk Foods
Neutral
248
-
2,090
1,987
2,379
7.6
9.0
12.4
18.3
20.0
13.6
2.8
2.5
8.2
13.2
1.2
1.0
Stock Watch
September 05, 2017
Company Name
Reco
CMP
Target Mkt Cap
Sales ( Čcr )
OPM(%)
EPS (Č)
PER(x)
P/BV(x)
RoE(%)
EV/Sales(x)
(Č)
Price ( Č)
( Č cr )
FY18E FY19E FY18E FY19E FY18E FY19E FY18E FY19E FY18E FY19E FY18E FY19E FY18E FY19E
zOthers
Radico Khaitan
Neutral
164
-
2,177
1,811
1,992
13.2
13.2
8.1
8.8
20.2
18.6
2.0
2.2
10.1
12.0
1.5
1.4
Relaxo Footwears
Neutral
512
-
6,155
1,981
2,310
13.7
14.5
12.0
15.5
42.7
33.1
8.3
6.7
0.2
0.2
3.2
2.7
Siyaram Silk Mills
Accumulate
2,237
2,500
2,097
1,769
1,981
12.7
12.7
113.1
131.1
19.8
17.1
3.1
2.6
15.5
15.5
1.4
1.2
Styrolution ABS India* Neutral
920
-
1,618
1,800
1,980
8.0
8.1
42.0
46.2
21.9
19.9
2.5
2.2
0.1
0.1
1.0
0.9
Surya Roshni
Neutral
315
-
1,380
4,870
5,320
7.7
7.8
22.8
28.1
13.8
11.2
1.8
1.6
0.1
0.1
0.5
0.4
TVS Srichakra
Neutral
3,290
-
2,519
2,729
2,893
12.7
12.5
248.5
265.0
13.2
12.4
3.8
3.1
0.3
0.3
0.9
0.9
Visaka Industries
Neutral
650
-
1,032
1,104
1,214
12.1
12.6
31.0
37.9
21.0
17.2
2.6
2.3
0.1
0.1
1.2
1.0
VIP Industries
Neutral
238
-
3,370
1,450
1,693
10.4
10.5
6.5
7.8
36.4
30.5
7.7
6.7
21.1
22.1
2.3
2.0
Navin Fluorine
Accumulate
663
730
3,267
945
1,154
22.4
22.6
28.7
34.8
23.1
19.1
3.8
3.3
-
-
3.0
2.3
Source: Company, Angel Research; Note: *December year end; #September year end; &October year end; Price as on September 04, 2017
Market Outlook
September 05, 2017
Research Team Tel: 022 - 39357800
DISCLAIMER
Angel Broking Private Limited (hereinafter referred to as “Angel”) is a registered Member of National Stock Exchange of India
Limited,Bombay Stock Exchange Limited and Metropolitan Stock Exchange Limited. It is also registered as a Depository Participant with
CDSL and Portfolio Manager with SEBI. It also has registration with AMFI as a Mutual Fund Distributor. Angel Broking Private Limited is a
registered entity with SEBI for Research Analyst in terms of SEBI (Research Analyst) Regulations, 2014 vide registration number
INH000000164. Angel or its associates has not been debarred/ suspended by SEBI or any other regulatory authority for accessing
/dealing in securities Market. Angel or its associates/analyst has not received any compensation / managed or
co-managed public offering of securities of the company covered by Analyst during the past twelve months.
This document is solely for the personal information of the recipient, and must not be singularly used as the basis of any investment
decision. Nothing in this document should be construed as investment or financial advice. Each recipient of this document should make
such investigations as they deem necessary to arrive at an independent evaluation of an investment in the securities of the companies
referred to in this document (including the merits and risks involved), and should consult their own advisors to determine the merits and
risks of such an investment.
Reports based on technical and derivative analysis center on studying charts of a stock's price movement, outstanding positions and
trading volume, as opposed to focusing on a company's fundamentals and, as such, may not match with a report on a company's
fundamentals. Investors are advised to refer the Fundamental and Technical Research Reports available on our website to evaluate the
contrary view, if any.
The information in this document has been printed on the basis of publicly available information, internal data and other reliable
sources believed to be true, but we do not represent that it is accurate or complete and it should not be relied on as such, as this
document is for general guidance only. Angel Broking Pvt. Limited or any of its affiliates/ group companies shall not be in any way
responsible for any loss or damage that may arise to any person from any inadvertent error in the information contained in this report.
Angel Broking Pvt. Limited has not independently verified all the information contained within this document. Accordingly, we cannot
testify, nor make any representation or warranty, express or implied, to the accuracy, contents or data contained within this document.
While Angel Broking Pvt. Limited endeavors to update on a reasonable basis the information discussed in this material, there may be
regulatory, compliance, or other reasons that prevent us from doing so.
This document is being supplied to you solely for your information, and its contents, information or data may not be reproduced,
redistributed or passed on, directly or indirectly.
Neither Angel Broking Pvt. Limited, nor its directors, employees or affiliates shall be liable for any loss or damage that may arise from
or in connection with the use of this information.